Infographics
Decrease information overload and engage your audience
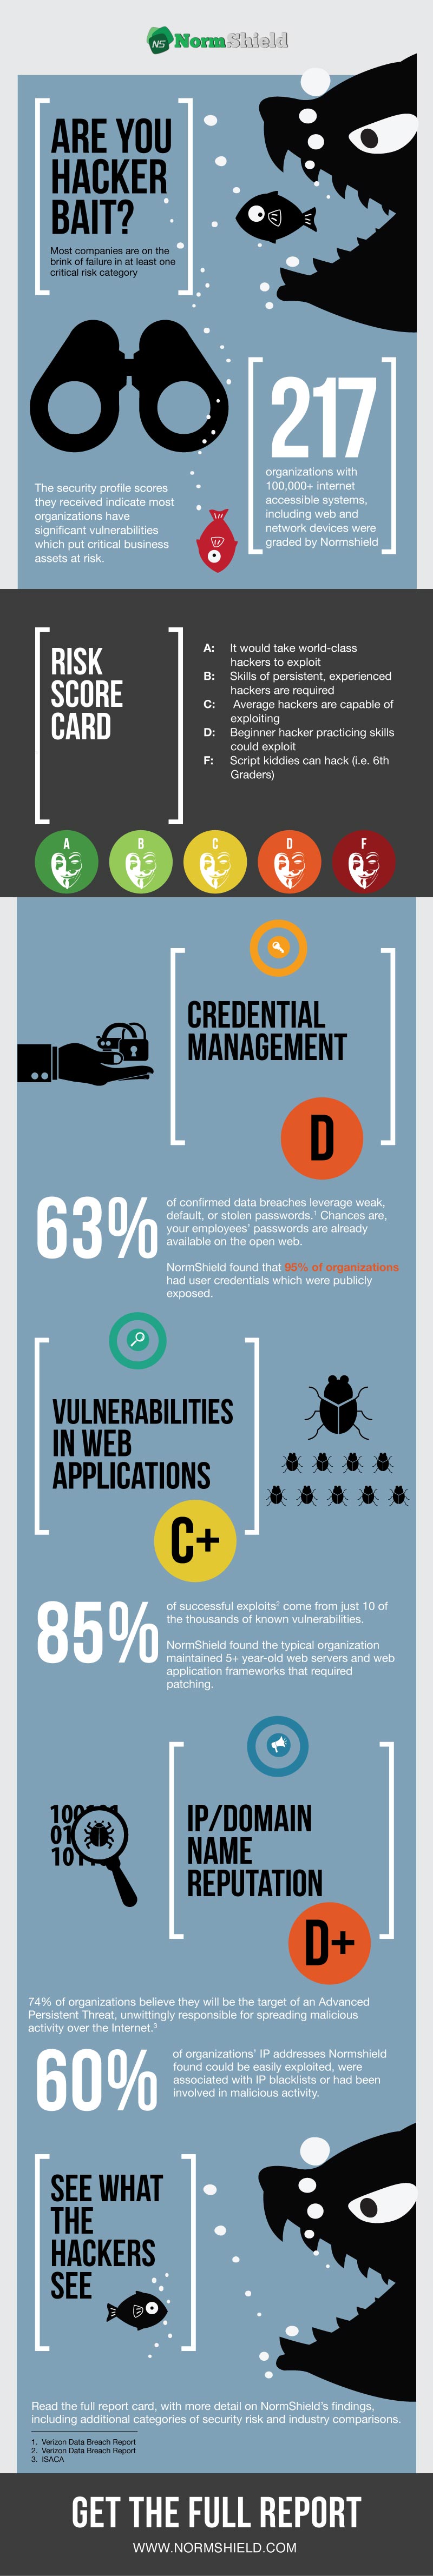
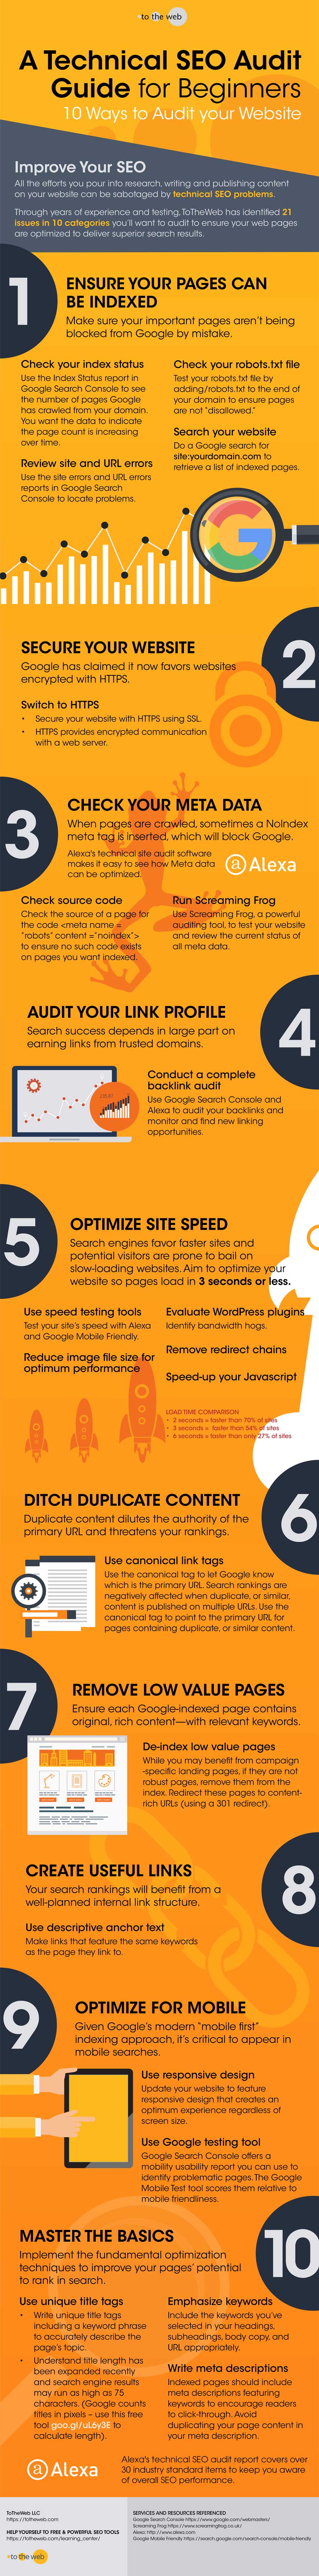
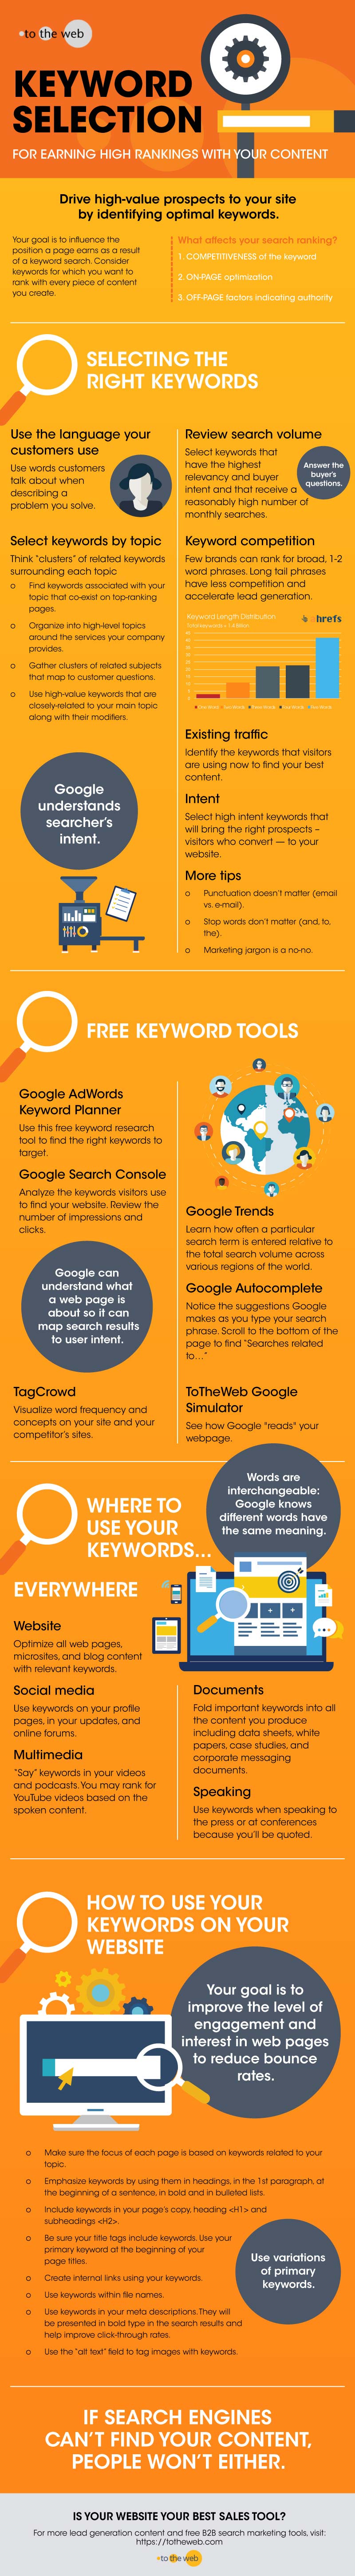
Use visuals as a shorthand to get your message across. After all, if the average adult reading speed is about 250 words per minute and visitors to your site generally decide to leave a page in the first 20 seconds, you’re not going to get much across in those first few seconds. Graphic visualisations of data are an excellent way of condensing facts, figures and statistics into something memorable and easily understood. Infographics make complex information simple. Show don’t tell.
ClientMultipleServicesGraphic Design